Maperial
Beautiful maps, crafted by you
An open source map platform
Maperial was an open source JavaScript API to create stunning WebGL maps in the browser. Co-founded in 2012, it was the front-end to our team's powerful backend exposing tiles from scientific data sources.
Users could compose multiple layers — basemaps, satellite imagery, SRTM elevation data, custom datasets — and blend them with real-time shaders. Every aspect of the map was customisable, from road widths and colors to terrain relief rendering.
The platform included a full-featured dashboard for managing maps, styles, datasets and colorbars. Users could create, share and embed their maps, making Maperial a complete cartography toolbox for developers and data scientists.
Built with JavaScript, HTML5 Canvas, WebGL and OpenStreetMap data. The rendering pipeline fused SRTM tiles with vector data on the fly, enabling real-time 3D-like terrain visualisation directly in the browser.
Maperial — platform walkthrough
Screenshots
Compose your world
The map editor let users build maps from scratch — add basemaps, overlay data layers, adjust composition settings with real-time blending modes. Every layer could be mixed independently using AlphaClip or MultiBand shaders.
Blend layers with shaders
Multiple layers could be stacked and blended in real-time. The composition panel offered shader controls to mix satellite imagery, elevation data and vector maps into unique visual combinations.
The Earth as your canvas
High-resolution satellite basemaps provided a photographic foundation. Users could zoom from a world view down to street level, with tiles loaded progressively from WMS and OpenStreetMap data sources.
SRTM elevation rendering
SRTM elevation data was fused in real-time to produce 3D-like terrain relief directly in the browser. Mountains, valleys and coastlines came alive with shaded relief and customisable color gradients.
Design every detail
The Style Editor gave full control over map appearance — roads, paths, water, land use, buildings, text labels. Each element type had dedicated controls for color, width, visibility and rendering order.
From classic to artistic
Users created and saved custom styles — clean classic maps, dark artistic themes, monochrome renderings. Styles could be applied to any map instantly and shared with the community.
Bring your data to life
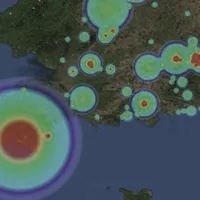
Maperial supported custom dataset overlays — heatmaps, animated timelines, categorical coloring. Upload a CSV, choose a colorbar, and watch your data appear on the map in seconds.
Scientific terrain analysis
SRTM data covered the globe at high resolution. From the Alps to the Sahara, from river valleys to ocean floors, elevation was rendered with customisable color ramps revealing the Earth's topology.
Your cartography toolbox
The dashboard centralised everything — maps, styles, datasets, colorbars. Users could manage their creations, organise projects, upload data files and keep track of all their cartographic assets.
Credits
JavaScript, HTML5 Canvas and WebGL for the front-end rendering engine. The backend exposed SRTM and OpenStreetMap tiles through a custom tile server. All map data from OpenStreetMap contributors.
Co-founded in October 2012 and developed until December 2014. Maperial was an ambitious cartography platform built by a small team passionate about maps, data and open source.
Related Projects

Adillions
I co-founded Adillions as full-stack developer to build a disruptive new sweepstake.

Diligis
Diligis was an app that helped you meet new business connections during your business trips. I've build the whole platform and mobile prototype

The Lightning Planet
My first mobile game developed with Solar2D. Available on iOS and Android.
Timeline
Browse the full timeline of my projects.